Customer Journey Mapping: A Startup Founder's Guide
Customer Journey Mapping: A Startup Founder’s Guide
Customer journey mapping means drawing every step a person takes with your company, from the first time they hear of you to the day they recommend you (or quietly leave), and marking what they do, think and feel at each step. For a startup, it’s the fastest way to see where your website, onboarding and pitch lose people. It’s also the brief any good designer wants before touching a layout. Build one map, around one customer, from real conversations, and your design decisions stop being guesses. 🗺️
Below: what a map contains, a seven-step way to build one, how to bend it for B2B, examples to borrow, and how it feeds the design work that actually moves your numbers.
TL;DR
- A journey map is a timeline of one customer’s goals, actions, thoughts, emotions and touchpoints, ending in concrete opportunities.
- Start small: one persona, one scenario, one goal. A map that tries to cover everyone covers no one.
- Talk to real customers. Interviews are the most-used research method among practitioners, and you can validate a draft with just a few people.
- For B2B, map a grid: stages across the top, each stakeholder down the side.
- The map only pays off when it changes your website, onboarding, emails or pitch deck.
Table of Contents
- What a customer journey map actually is
- Why startups should bother
- What goes on a journey map
- How to create a journey map in seven steps
- Customer journey map examples you can borrow
- Mapping a B2B journey
- Turning the map into design decisions
- Common mistakes (we’ve made a few of these ourselves 😅)
- Where design comes in
- Our perspective
- FAQ
- Sources
What a customer journey map actually is
Think of it as a storyboard for your customer’s relationship with you. Harvard Business School’s online blog describes it as a visual representation of every step a customer takes when interacting with a brand, anything from a simple timeline of touchpoints to a detailed diagram. The point is to understand each interaction in the buying process and design better ones.
The U.S. General Services Administration’s IT Modernization Centers of Excellence adds a useful detail: a good map includes the messy parts. That means official processes, workarounds, incidental steps, and the emotions, positive and negative, people feel along the way. Your customer doesn’t follow your funnel diagram. They Google you at midnight, forward your pricing page to a cofounder, get confused by a signup form, and come back three days later. The map captures that.
A quick vocabulary check, since this field loves jargon:
- Touchpoint: any moment of contact with you: a website page, an email, a demo call, a support chat, a booth at a conference.
- Persona: a research-based profile of one type of customer, not a made-up character with a stock photo and a favorite coffee order.
- Scenario: the specific situation you’re mapping, such as “a first-time founder looking for a designer to rebuild their website before a funding round.”
- Pain point: a moment where the customer is stuck, frustrated or about to give up.
Why startups should bother
Because you have limited time, a small team, and no budget to redesign things twice. A map tells you which single moment to fix first.
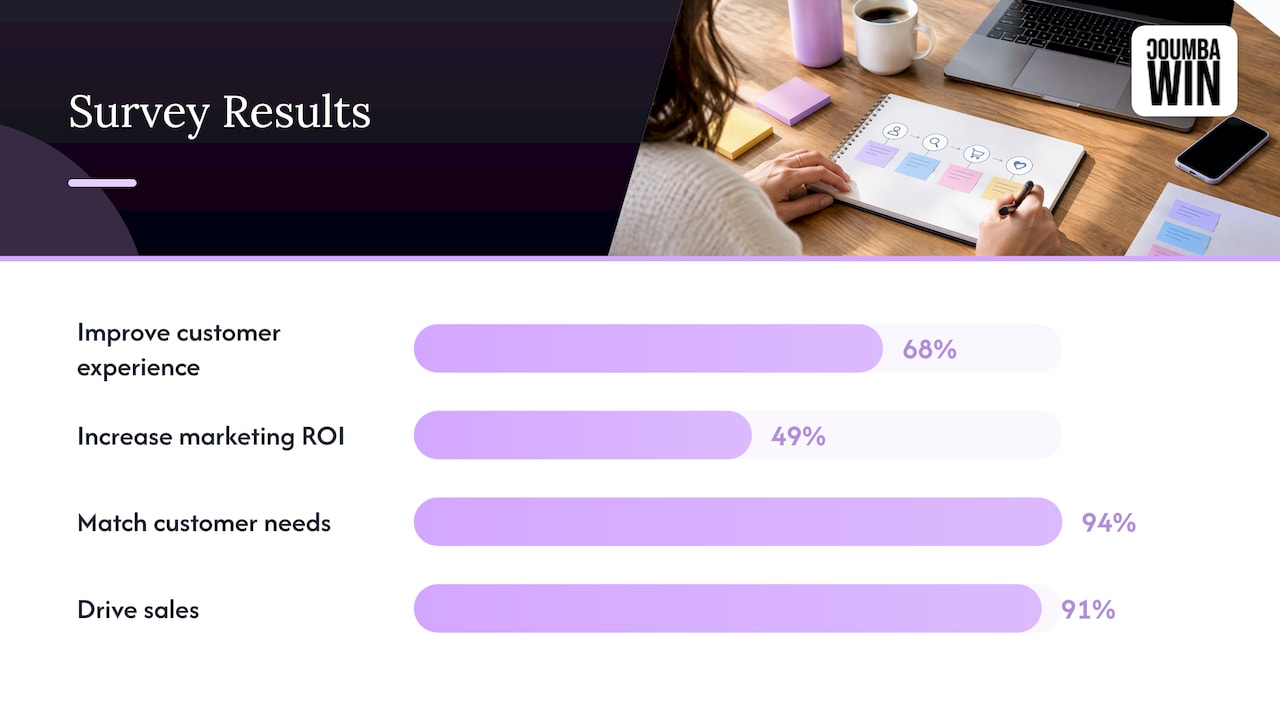
You’re also in good company. A Hanover Research survey of 400 U.S. companies found 68% of organizations create journey maps to improve customer experience and 49% to increase marketing ROI. The same report found 94% of businesses said maps helped them develop products and services that match customer needs, and 91% said they helped drive sales. Those are self-reported results from a survey, not guarantees, but they show the practice is mainstream, not academic.
For founders specifically, a map helps with three things:
- Prioritizing. You can’t fix the whole experience, so you find the one drop-off that hurts most.
- Aligning. When your cofounder says “people love the product” and your designer says “nobody finds the pricing page,” the map puts both truths on one page.
- Pitching. Investors respond to founders who understand exactly how customers arrive, decide and stay.
What goes on a journey map
The Nielsen Norman Group, a UX research and consulting firm, breaks a map into three zones, which is the cleanest mental model I know:
| Zone | What it holds | Startup example |
|---|---|---|
| The lens | Persona, scenario and the customer’s goal | A seed-stage founder who needs a new website before a demo day |
| The mapped experience | Phases, actions, thoughts, emotions, touchpoints and channels | Searches for designers, compares portfolios, books a call, reviews a proposal |
| Insights | Pain points, opportunities and who owns each fix | “Proposal took too long” becomes a task owned by whoever runs sales |
Most maps use five rough phases: awareness, consideration, decision, retention and advocacy. Salesforce’s training module notes that a shift in thoughts or feelings often signals a new phase, so don’t force your own journey into five boxes if your customers clearly have six.
Don’t skip the feelings row
It’s the row everyone drops because it feels soft. Resist. Behavior tells you what happened; emotion tells you why, and where to intervene. Draw a simple line across the phases: high when the customer is excited, low when they’re confused or worried. The dips are your design brief.
Want a nudge on the audience side of this? Understanding what your audience actually needs is the raw material for the persona and goal at the top of the map.
How to create a journey map in seven steps
There’s no single official method. Here’s a version that works for small teams, drawing on the process in Digital.gov’s federal guide and Nielsen Norman Group’s research on how practitioners work.
1. Pick one goal and one scope
Decide what question the map answers. “Why do trial users not activate?” is a map. “Everything about our customers” is a wall of sticky notes you’ll never look at again. Where it goes wrong: scoping to the whole company because it feels more thorough.
2. Choose one persona and one scenario
Pick the customer who matters most to revenue right now. If you serve two very different people (say, a founder buying design and an operations lead approving the invoice), they get separate maps. Base the persona on real conversations or data, not on who you wish was buying.
3. Write down what you already believe
Here’s something reassuring. In a Nielsen Norman Group survey of practitioners, 62% used a hypothesis-first approach built from existing team knowledge, while 35% began with a dedicated research phase. Their workshop guide suggests an assumption map on sticky notes, so you can see which gaps need real research. Do this with your team in an hour. The disagreements are the most useful output.
4. Fill the gaps with real customer input
User interviews were the most-used method in that same survey, at 86% for external user research. Diary studies were the least used. For a startup, five to eight conversations with recent customers (and a couple who didn’t buy) is a sensible start. Add what you can measure: analytics, session recordings, support tickets, sales call notes. Ask people to walk you through what happened, not whether they liked your site.
5. Map the stages, actions and touchpoints
Lay the timeline out left to right. Under each phase, note what the customer does, where they do it, and what they need to decide. Include the unglamorous steps: the Slack message to a cofounder, the PDF forwarded to a finance person, the tab they left open for a week.
6. Add thoughts, feelings and pain points
For each phase, write what the customer is thinking in their own words (quotes from interviews are gold) and score how they feel. Then mark the pain points. Digital.gov also asks teams to note potential harms, such as a financial penalty or a damaged reputation, which is a good lens for any product that handles money or sensitive data.
7. Turn pain points into opportunities, then validate
For each low point, write one specific change and one owner. “Improve onboarding” is a wish. “Cut the signup form from nine fields to four, owned by the product designer” is a task. Then show the map to people who know the process, including someone from your customer group, as the GSA guidance recommends. Fix what they say is wrong, and schedule a review. A map is a living document, not a poster.
Customer journey map examples you can borrow
People searching for examples usually want a picture. Here are three shapes, described so you can sketch them yourself in a doc or on a whiteboard.
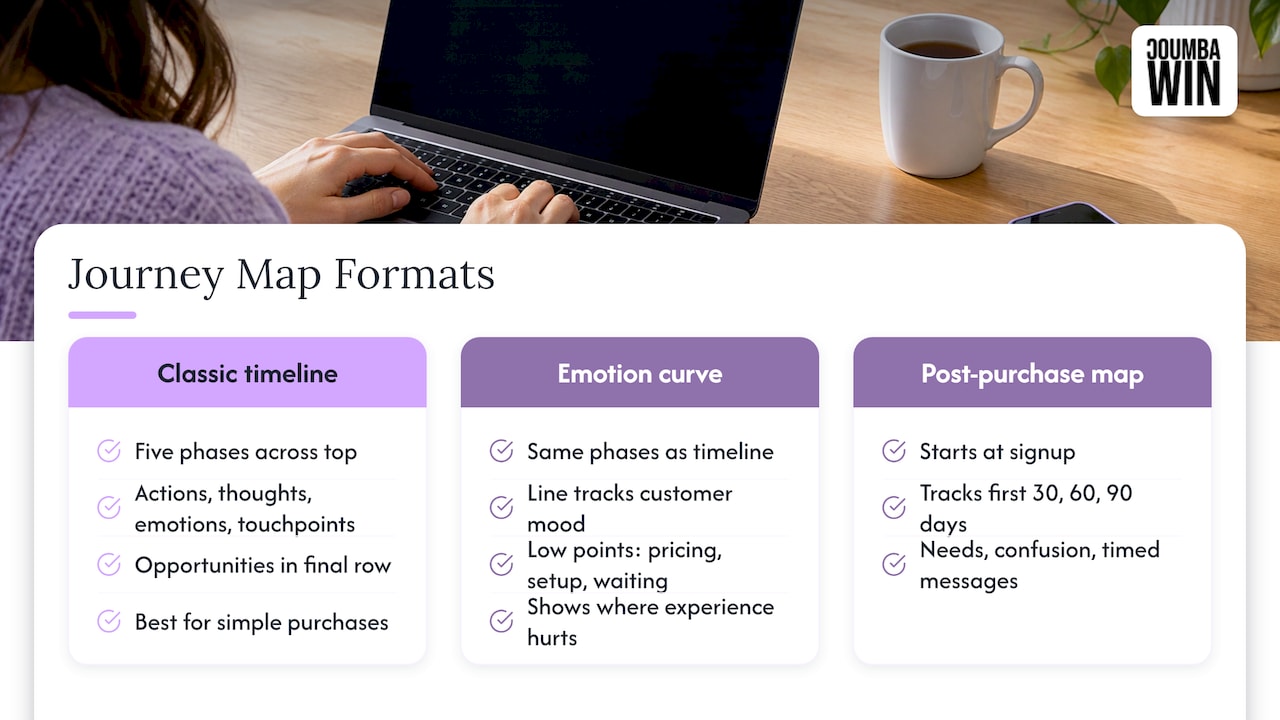
The classic timeline. Five phases across the top, rows for actions, thoughts, emotions and touchpoints, and a final row of opportunities. Best for a first map of a simple purchase, like a founder booking a website redesign.
The emotion curve. Same phases, but the hero of the page is a line that rises and falls with the customer’s mood. It’s the fastest way to show a skeptical teammate where the experience hurts. The low points tend to cluster around pricing, setup and waiting.
The post-purchase map. Many startups map only up to signup. Flip it. Start at the signup and chart the first 30, 60 and 90 days: what the user needs to do to see value, what confuses them, which email or in-app message arrives when. Our own 30/60/90 day freemium onboarding guide walks through that structure, and our piece on onboarding email sequences shows how the messages line up with the moments you’ve mapped.
Mapping a B2B journey
B2B is where a single line across the page breaks down, because several people take part in one purchase. A founder’s customer might include the person who uses the product, a technical reviewer, a budget holder and someone in procurement, each with different worries.
The Hanover Research survey above found B2B companies had the lowest adoption of journey mapping, at 42%, but the biggest increase in use, up 17% from 2019. Many of your future competitors are only now starting, so doing it well is an edge.
The practical fix is a grid, not a line:
| Awareness | Evaluation | Decision | Onboarding | Renewal | |
|---|---|---|---|---|---|
| End user | Finds you via search or a peer | Tries the product | Asks for it | Learns the basics | Reports value |
| Technical reviewer | Rarely involved | Checks security and integration | May raise late objections | Handles setup | Watches reliability |
| Budget holder | Unaware | Wants proof of results | Approves spend | Checks early wins | Decides to renew |
Each cell holds that person’s goal, touchpoint and friction. Look down the columns and you’ll see where stakeholders’ needs collide, and which materials you’re missing: a technical overview for the reviewer, a short case study for the budget holder, a clean pitch deck for the first meeting. If you sell to businesses, those assets are design work as much as content work.
Turning the map into design decisions
A map that lives in a slide deck is decoration. The payoff comes when each opportunity becomes a design change. Here’s how the usual findings translate:
- “They couldn’t tell what we do.” Home page and brand messaging problem. Fix the hierarchy, the headline and the proof above the fold.
- “They loved the demo, then went silent.” A gap between decision and follow-up. Look at your proposal, pitch deck and follow-up emails.
- “Signup was easy, then they got lost.” Onboarding UX problem. Check the first-run screens and the early emails.
- “They searched for a specific answer and didn’t find us.” SEO and content gap.
- “A few users couldn’t complete a task.” An accessibility problem worth a proper audit.
If you want to see how research feeds decisions, our piece on why UX research drives product strategy goes deeper, and user engagement design covers what to do after you’ve found the drop-off.
Common mistakes (we’ve made a few of these ourselves 😅)
- Mapping the company’s view. Your internal process isn’t the customer’s journey. Start from their goal.
- Making one map for everyone. Averages hide the pain.
- Skipping validation. An untested map is a well-formatted opinion.
- Over-polishing. A rough map used this week beats a gorgeous one finished next quarter.
- Never revisiting it. Your product and customers change. Put a review on the calendar.
Where design comes in
Once you know where customers stall, you need someone to fix it with craft, not templates. Coumba Win is a design partner for startups: we do UX and UI design, web design and development, Webflow development, pitch deck design, SEO optimization, email marketing, ad management and accessibility audits. We work closely with founders, and we don’t hand out generic templates or AI-generated design, because a map full of specific insights deserves specific answers.
Have a map, or a hunch about where customers drop off? Take it to us and we’ll look at what it means for your website, platform or pitch. See what we do on our services page or our Webflow development work.
Our perspective
Founders often tell us they want a “better website.” What they usually mean is that someone arrives, doesn’t quite understand what happens next, and leaves. That’s a journey problem long before it’s a color problem.
We think of a journey map as a conversation starter between a founder and a designer. It forces the question every good design brief starts with: who is this person, what are they trying to do, and where do we get in their way? When a founder arrives with even a rough map, the work gets sharper fast, because we’re designing for a real moment instead of a general idea of “users.”
That’s why we care so much about custom work. A template can’t know that your buyers need a technical overview before the budget holder sees pricing. A designer who has talked it through with you can. We’d rather build the one thing that fixes your biggest drop-off than ten things that look nice.
Start with one persona, one scenario, and one honest afternoon with your team. Then make the changes the map points to.
Coumba Evelyn
FAQ
What are the stages of the customer journey?
Most maps use five: awareness, consideration, decision, retention and advocacy. Some add onboarding or expansion, especially for software. Use the stages that match how your customers actually behave, and let changes in their thoughts and feelings tell you where one phase ends.
How long does it take to build a journey map?
A first version can come together in a few days: an hour for an assumption workshop, a handful of customer interviews, and a session to assemble the map. A deeper B2B map with several stakeholders takes longer. Treat the first version as a draft to refine.
Do I need special software?
No. A whiteboard, sticky notes or a shared document is enough for a first map. What matters is the research behind it and the follow-through afterward, not the tool.
What’s the difference between a journey map and a funnel?
A funnel counts how many people move between stages. A journey map explains what those people do, think and feel along the way, and why they drop out. Use the funnel to find where to look, and the map to understand what’s happening there.
How is B2B journey mapping different?
B2B purchases involve several people with different goals, so you map each role’s path in a grid instead of one line. Look for the handoffs and for materials that a specific stakeholder needs and doesn’t have.
Sources
- What Is a Customer Journey Map? (GSA IT Modernization Centers of Excellence)
- Customer Journey Maps: When and How to Create Them (Nielsen Norman Group)
- How Practitioners Create Journey Maps (Nielsen Norman Group)
- How to Run a Journey-Mapping Workshop (Nielsen Norman Group)
- Map your users’ and system’s journeys (Digital.gov)
- The Power of Customer Journey Mapping (Hanover Research)
- Revamp Customer Experience with Journey Mapping (Trailhead)